Disclaimer: If you haven’t read/watched day 1, I recommend you do that before reading this article.
For those of you who prefer to watch a video I made on my channel regarding my journey:
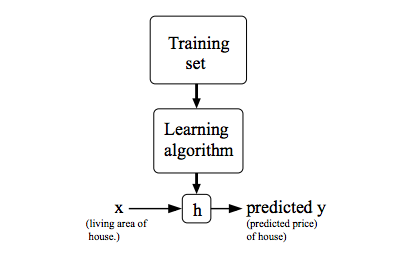
Model Representation
We’ll use symbols like x^(i) for input, and y^(i) for the output to figure out. So the pair (x^(i), y^(i)) is the i-th training example. Using this dataset we want to create a hypothesis that takes an input (x) and gives us a good guess for the output (y).
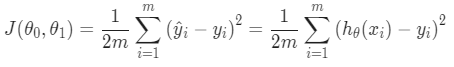
Cost Function
The cost function is used for measuring how good our hypothesis is at measuring things. By looking at the average difference between what our guess says (hypothesis) and what actually happens (the real result).
The cost function is like saying, “How wrong are we on average?” It calculates the mean (average) of the squared differences between our guess and the real outcome. This is known as the “Squared Error” or “Mean Squared Error” function.
The cost function helps us figure out how much we need to adjust our guess to get it right the next time.
Linear Regression with One Variable
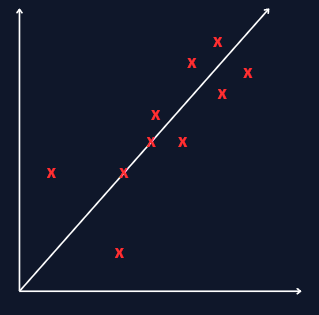
Alright, let’s break it down. Imagine you have a bunch of points on a graph. You want to draw a straight line (represented by hθ(x) = θ₀ + θ₁x) that goes through these points in the best way possible.
The idea is to find θ₀ and θ₁ so that the average squared vertical distance from the points to the line is as small as possible, this will minimize our cost function.
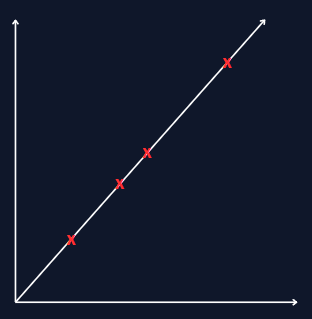
In a perfect scenario, the line would go exactly through every point, and the cost would be 0:
But usually, nothing is perfect and we will most of the time end up with something like this: