Disclaimer: If you haven’t read/watched day 4, I recommend you do that before reading this article.
For those of you who prefer to watch a video I made on my channel regarding my journey:
Polynomial Regression
If a linear function does not fit our data well, we can change the behavior or curve of our hypothesis function by making it a quadratic (hθ(x) = θ₀ + θ₁x₁ + θ₂x₁²), cubic (hθ(x) = θ₀ + θ₁x₁ + θ₂x₁² + θ₃x₁³), square root (hθ(x) = θ₀ + θ₁√x₁) function or any other form.
For example:
- If our data looks like this:
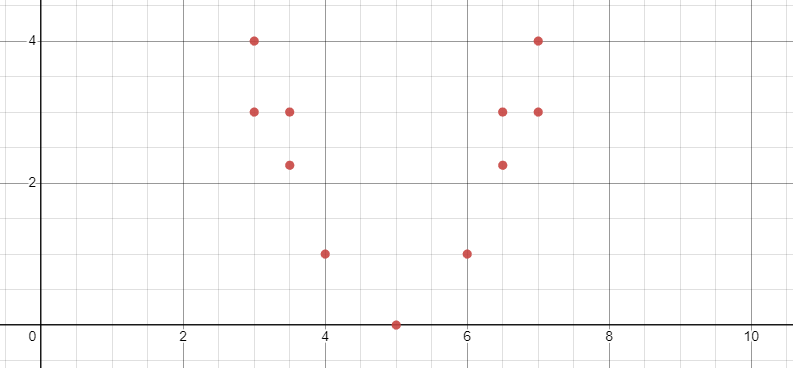
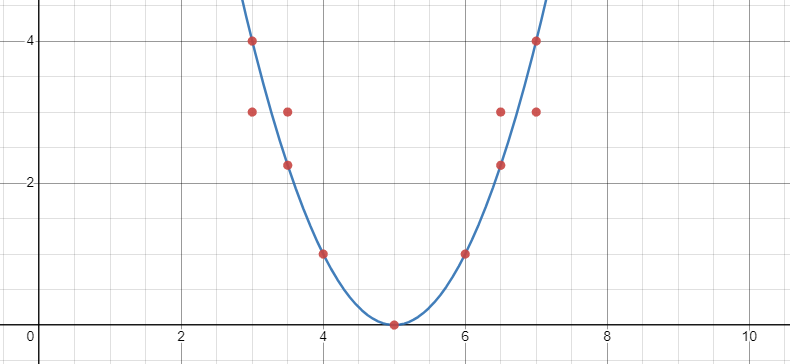
A quadratic hypothesis function (hθ(x) = x₁² - 10x₁ + 25) will be a good match:
- If our data looks like this:
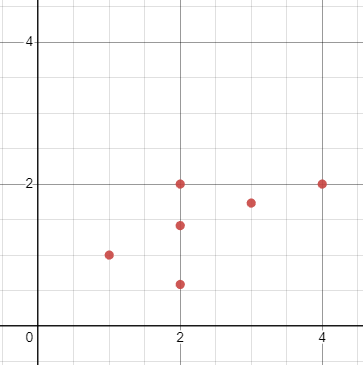
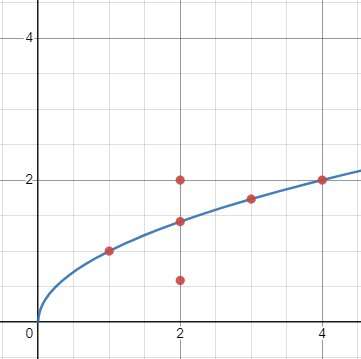
A squared root hypothesis function (hθ(x) = √x₁) will be a good match:
Features
-
Combining Features - sometimes one feature is dependable on another feature, in this case, we combine them into one. For instance, if we want our hypothesis function to ignore x₂ when x₁ = 0 and address x₂ when x₁ = 1 we can introduce a new feature x₃ = x₁x₂ to our hypothesis, and end up with hθ(x) = θ₀ + θ₁x₁ + θ₃x₁x₂.
-
Scaling - when using a polynomial hypothesis one thing to keep in mind is the range of our features. For instance, if our hypothesis is of the form hθ(x) = θ₀ + θ₁x₁ + θ₂x₁² + θ₃x₁³, and x₁ has a range 1 - 1000 then a range of x₁² becomes 1 - 1000000 and that of x₁³ becomes 1 - 1000000000 giving x₁³ a great impact on our hypothesis output.